eero-go & eero-stats
2 min read
7 views
eero-go GitHub · eero-go pkg.go.dev
eero-stats GitHub · eero-stats pkg.go.dev
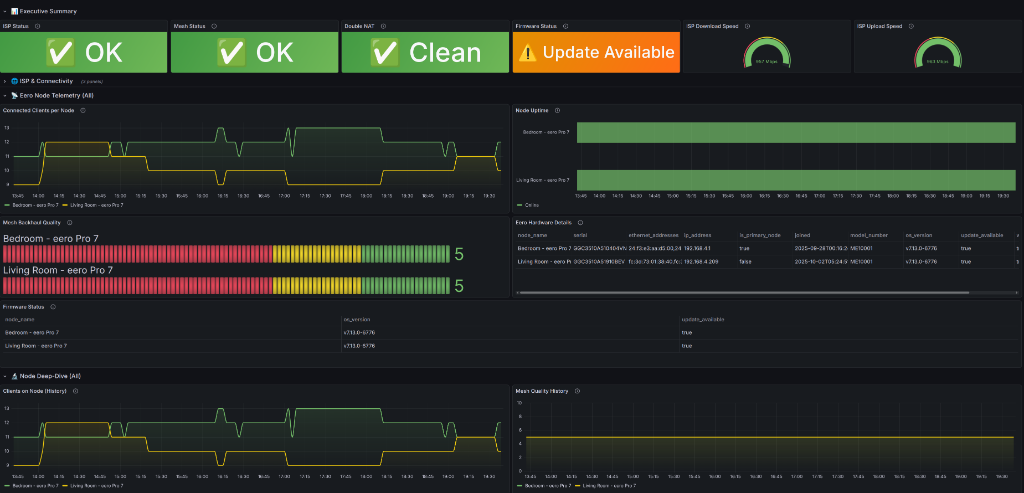
What you're missing
You have an eero router but not eero+, and want to own the ISP stats of your network that can be accessed via web and anywhere if you're on tailscale.
How many devices are online?
What band are my devices connected to?
What's my ISP speed?
Why you need this
This project is split in two. If you're a dev and want to have a lightweight package to query eero
router stats then eero-go is an easy install away.
If you want a fully fledged dashboard with historical data and charts, then eero-stats is what you need.
Either way, with these two packages, you have a self-hosted way to own your router and ISP data and say goodbye to eero plus.
How do I get this?
eero-go (the library)
Prerequisites: Go 1.21+.
1go get github.com/arvarik/eero-go
Run the included interactive CLI to authenticate via Eero's 2FA flow and cache your session:
1go run ./cmd/example
The token is saved to .eero_session.json (with 0600 permissions) so subsequent runs skip 2FA entirely.
eero-stats (the dashboard)
Prerequisites: Docker and an Eero mesh network.
1git clone https://github.com/arvarik/eero-stats.git && cd eero-stats2cp .env.example .env3# Set EERO_LOGIN to your Eero account email or phone4make docker-up
This launches the poller daemon, InfluxDB, and Grafana. On first boot, attach to the container (docker attach eero-stats) to enter your one-time 2FA code. The Grafana dashboard is auto-provisioned at http://localhost:3000.
The daemon uses tiered polling (3 min for device/node health, 90 min for metadata, 12 hr for ISP speed tests), designed for minimal NVMe wear.